Institutional Breakout Analysis: Integrating Structural Liquidity with Statistical Confluence
Successful breakout trading in contemporary markets requires more than simple horizontal level detection. It demands a multi-layered approach that accounts for institutional liquidity distribution and historical probability frequency. This guide examines the MetaTrader 5 implementation of our structural breakout suite, focusing on the synergy between pivot identification and probability matrices.
I. Architecture of Structural Pivot Identification
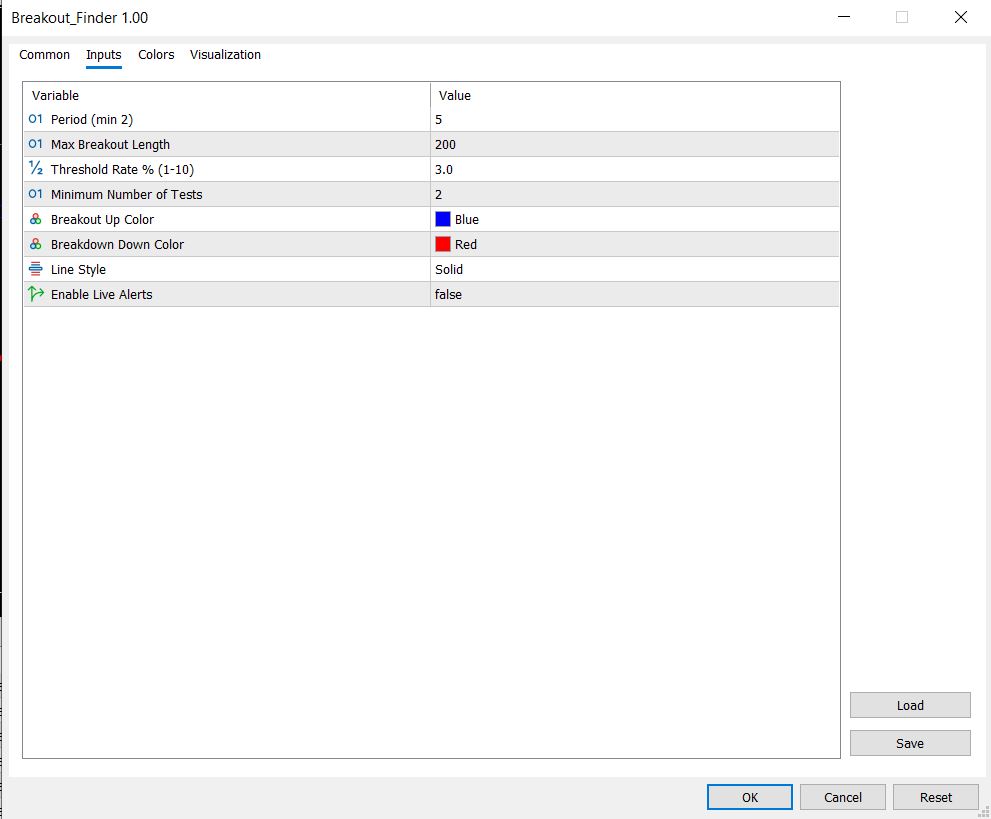
The core of the BreakOut Finder lies in its ability to filter retail "noise" from institutional supply and demand zones. Unlike standard fractals, the algorithm utilizes a programmable InpPeriod to determine the look-back and look-ahead density required to confirm a valid price pivot.
Mechanically, a Pivot High is established when a specific price point is verified to be higher than all price action within the surrounding window. These points are stored in dynamic arrays—phval[] and plval[]—to build a historical map of critical reaction zones. By setting a ThreshRate %, the indicator recognizes that liquidity isn't a single line but a zone. This allows for the identification of a "Liquidity Buildup" where multiple pivots align within a narrow price range, suggesting a cluster of institutional orders.
BreakOut Finder Logic
The system triggers a signal only when an expansion candle closes beyond the highest pivot in a cluster, provided the InpMinTest (minimum number of rejections) has been met. This significantly reduces the frequency of "fake-out" signals that lack institutional backing.
II. The Historical Probability Matrix
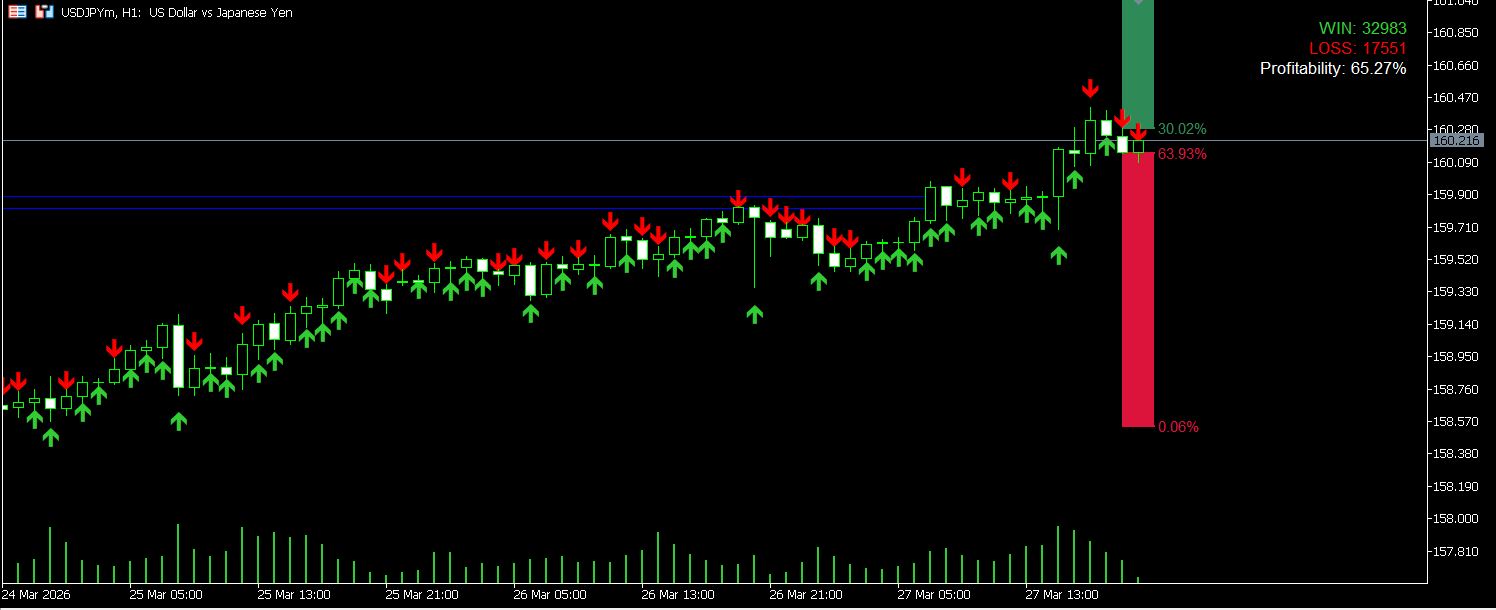
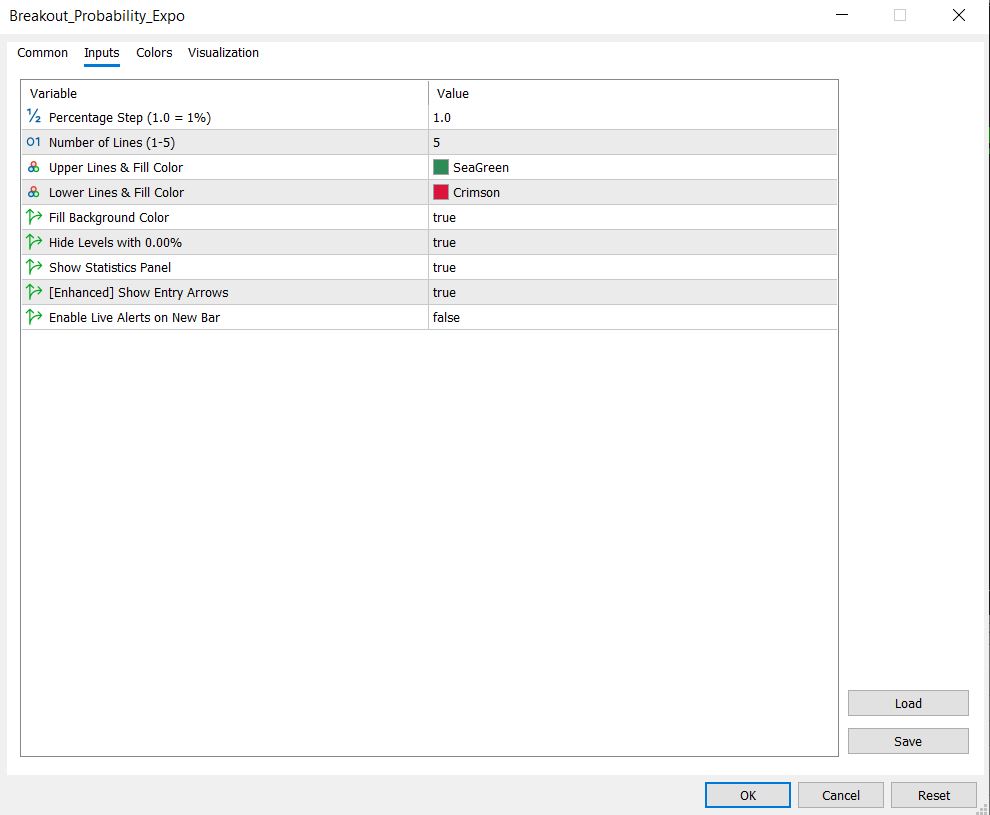
To augment the structural setup, we utilize the Breakout Probability indicator. This component functions as a real-time backtesting engine. It maintains a constant tally of the win/loss distribution for previous breakout attempts relative to the current market volume and volatility.
The indicator calculates probabilities across multiple expansion levels (Steps) based on the InpPerc parameter. By quantifying how often a bullish or bearish candle has historically reached Target X after a Level Y breakout, it provides a "Mathematical Bias." This statistical filter ensures that trades are only executed when the current market environment shows a high frequency of successful continuation in the past.
III. USDJPY: A Case Study in Institutional Consistency
While high-volatility assets like Gold (XAUUSD) often produce deeper retracements into liquidity zones, USDJPY exhibits a more persistent trend structure. This behavior necessitates a tighter ThreshRate and a higher MinTest to capitalize on the pair's tendency to respect established levels before significant trending moves.
Optimized Parameter Set: USDJPY M30
| Parameter | Value | Functional Rationale |
|---|---|---|
| Finder Period | 6 – 8 | Filters intraday noise while maintaining structural relevance. |
| Threshold Rate | 1.5% – 2.0% | Optimized for the lower relative volatility of USDJPY vs Gold. |
| Probability Step | 0.2 – 0.4 | Smaller steps provide more granular data for controlled moves. |
| Min Tests | 3 | Ensures resistance/support is well-established before expansion. |
IV. Strategic Execution: Setup and Confluence
Execution is strictly bounded by the confluence of both indicators. The strategy transitions through three critical phases:
- The Setup: BreakOut Finder constructs a consolidation zone (Box) after identifying multiple pivots at the same price horizontal (Threshold).
- The Filter: Probability Finder is consulted to verify the "Bias." If the upside probability is below 55% during a resistance break, the trade is discarded regardless of candle strength.
- The Trigger: Entry is confirmed upon a candle close beyond the zone boundaries, accompanied by the appearance of a Signal Arrow and verified statistical backing.
Institutional Package Download
Access the complete MetaTrader 5 technical suite below. The package includes the compiled .ex5 binaries for both the structural finder and the probability matrix.