Advanced Day Stats Analytics Dashboard Indicator (MT4 & MT5) – Multi-Pair Daily Market Statistics Dashboard
Download Advanced Day Stats Analytics Dashboard Indicator for MT4 & MT5
The Advanced Day Stats Analytics Dashboard Indicator is a powerful statistical trading dashboard designed for MetaTrader 4 (MT4) and MetaTrader 5 (MT5) platforms. This advanced indicator analyzes historical daily candle data across multiple currency pairs and presents clear, actionable market statistics directly on your trading chart.
Built for professional traders, quantitative analysts, and price-action traders, this dashboard automatically calculates daily ranges, candle body statistics, wick averages, bullish/bearish probabilities, and high-probability buy and sell zones. The result is a real-time trading intelligence panel that helps traders quickly identify market bias, volatility levels, and statistically significant trading opportunities.
You can download the executable indicator files (.ex4 for MT4 and .ex5 for MT5) and install them instantly on your MetaTrader platform.
What is the Advanced Day Stats Analytics Dashboard?
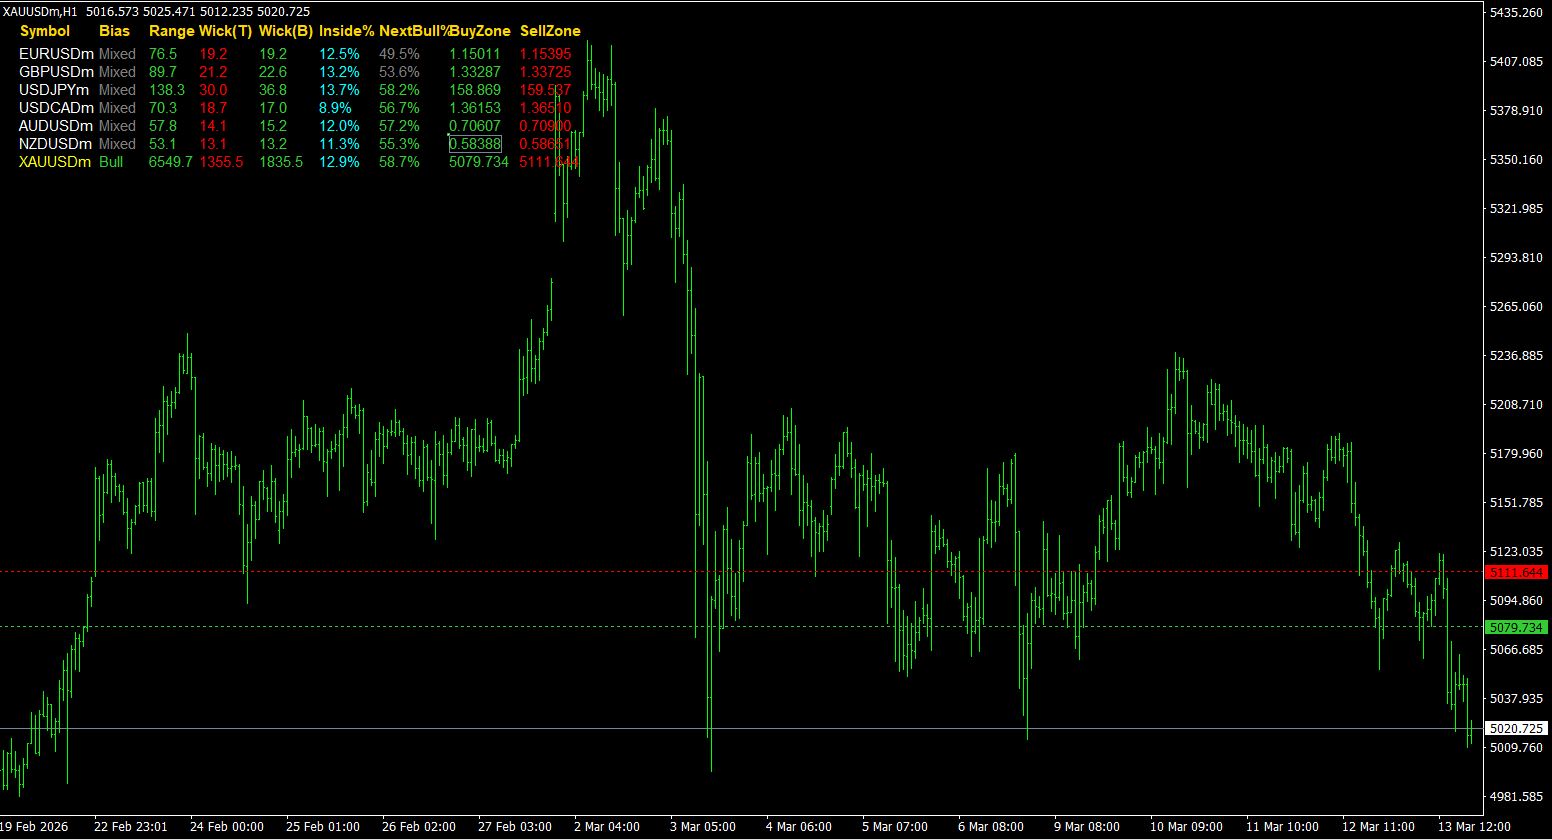
The Advanced Day Stats Analytics Dashboard is a multi-symbol statistical analysis indicator that scans hundreds of days of historical price data and converts it into a compact dashboard interface directly on your chart.
Unlike traditional indicators that rely only on technical formulas, this tool uses statistical market behavior to show:
- Average daily range
- Bullish vs bearish probability
- Candle wick behavior
- Inside bar frequency
- Next candle probability
- Estimated buy and sell price zones
The dashboard processes multiple trading symbols simultaneously and automatically adapts to broker symbol suffixes or prefixes. This makes it extremely useful for forex traders, gold traders, and multi-pair analysts.
Key Features of the Dashboard Indicator
Multi-Pair Market Analysis
The indicator scans a list of symbols such as: EURUSD, GBPUSD, USDJPY, USDCAD, AUDUSD, NZDUSD, and XAUUSD. Traders can customize the list to include any forex pair, index, crypto pair, or commodity supported by their broker.
Automatic Broker Symbol Detection
Many brokers add suffixes such as .m, .pro, or .a to their instruments. The dashboard automatically detects and resolves these variations using auto symbol resolution logic, ensuring the indicator works across different broker environments without manual adjustments.
Daily Range Analytics
The indicator calculates the average daily range in pips using historical daily candles. This helps identify high volatility pairs suitable for intraday trading and low volatility pairs better for swing trading. Pairs exceeding minimum targets are highlighted.
Bullish vs Bearish Market Bias
By calculating the percentage of bullish and bearish daily candles, the dashboard determines the overall directional bias (Bullish, Bearish, or Mixed). This provides traders with a statistical perspective on market direction.
Candle Wick Statistics
The indicator measures upper and lower wick averages to provide insight into institutional rejection zones, liquidity sweeps, and market exhaustion areas. These statistics help estimate probable daily reversal levels.
Dashboard Interface Overview
Smart Buy Zone and Sell Zone Detection
The dashboard automatically calculates estimated daily buy and sell zones based on historical wick behavior. These zones indicate where the market historically forms lower wick rejections (Buy Zone) or upper wick rejections (Sell Zone).
Download Advanced Day Stats Analytics Dashboard Indicator
You can download the indicator files for both MetaTrader platforms below. Both versions contain the same comprehensive statistical dashboard functionality.
Installation Guide
For MT4:
- Open MT4 and go to File -> Open Data Folder.
- Navigate to MQL4 -> Indicators and paste the .ex4 file.
- Restart MT4 and attach to any chart.
For MT5:
- Open MT5 and go to File -> Open Data Folder.
- Navigate to MQL5 -> Indicators and paste the .ex5 file.
- Restart MT5 and apply to your chart.